Intel® VTune™ Profiler: Basic Installation
How to Get Started with Intel® VTune™ Profiler
Step 1: Download the VTune Profiler
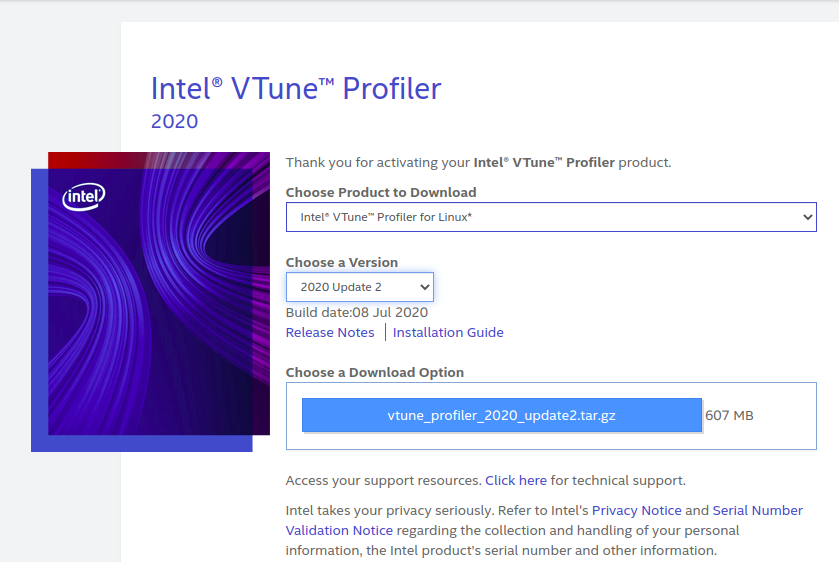
Get the desired version from the official page HERE
I used the version 2020.update2. The next steps can be followed as per the guide provided HERE. Open the PDF version for your OS. I am using Ubuntu 18.04.4 LTS. I will mention the steps I followed from it.
Step 2: Install Prerequisites
On Ubuntu* or Debian*, install the following libraries:
sudo apt-get install libgtk-3-0 libasound2 libxss1 libnss3
On Red Hat* Enterprise Linux or CentOS*, install the following libraries:
sudo yum install gtk3 alsa-lib libXScrnSaver nss
On Fedora*, install the following libraries:
sudo dnf install gtk3 alsa-lib libXScrnSaver nss
On SUSE* Linux* Enterprise Server (SLES), install the following libraries:
sudo zypper install gtk3 libasound2 libXss1 mozilla-nss
Step 3: Install with “Installer GUI”
Use the following steps to install :
-
Extract the installation package to a writeable directory with the following command:
$ tar -xzf vtune_profiler_<version>.tar.gz -
cdto the directory containing the extracted files. -
Run the following command to launch the installer:
$ ./install_GUI.shRunning it using
sudoprivilage, will install inHOME/opt/intel/. The installer will guide you through the installation process. You can install using the default options or customize your installation. -
After installation succeeds, run the following command to establish the environment:
For bash command interpreter:
$ source <install-dir>/vtune-vars.sh
Step 4: Setup project in VTune
Refer to this Udacity tutorial video
Step 5: Source Environment
By default, the < install-dir > is the following:
-
/opt/intel/vtune_profiler_< version >when installed with root permissions; -
$HOME/intel/vtune_profiler_< version >when installed with user permissions; -
/opt/intel/inteloneapi/vtune/< version >for Intel oneAPI Base Toolkit installation.
Run
$ source < install-dir >/env/vars.sh
Step 6: Run VTune
Run the GUI using
$ vtune-gui
For more info and on What can You do using VTune Amplifier, refer to the official site.
Some Advanced concepts in VTune
The advances profiling gives advantages as
- It gives the hardware usage and helps in optimizing the application to utilize all the underlying hardware.
- It helps in fixing areas of code that are not optimized.
The following tutorial shows how individual threads can be analysed.
In the analysis, the colors have the following significance
| Color | Description |
|---|---|
| Green | Running Time |
| Brown | CPU Utilization |
| Red | Spin and Overhead Percentage |
The line that took the most CPU Time can be found as